Monday, March 15, 2010

Charles River Bike Path Flooded in Watertown

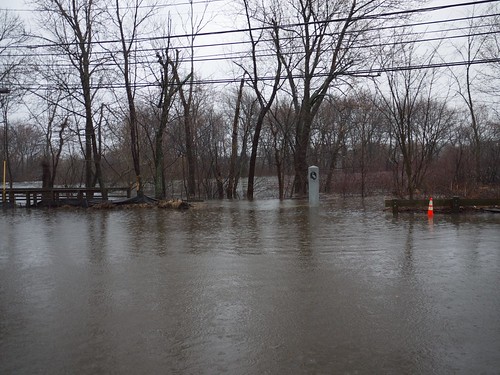
In the past month, while out for runs in the mornings on the bike paths along the Charles River, I noticed that the water level had been getting quite low.

No longer.

The Aguageddon -- make that the H2OMG -- looks to be flooding the bike path along the Charles River on the north side in Watertown.

I know where I'm not going for a run Tuesday morning.


Image of flooded Charles River:

Tuesday, March 09, 2010

Which Allston-Brighton Public Library is Most Likely to be Closed?

The Trustees of the Boston Public Library are compiling data in order to determine up to ten branch libraries to close in order to address a budget shortfall of $3.6 million.

Three of the 26 branch libraries are located in Allston-Brighton; statistically speaking, one of those three is therefore facing closure.

Which one?

On one level, it would be politically disastrous to close the Honan-Allston Public Library in North Allston, since it is named after the deceased brother of current State Representative Kevin Honan. The Brighton Branch Library near Brighton Center would seem an unlikely target, too, since it is currently undergoing renovations -- if it were to close, the money already spent would be tossed down the toilet.

That leaves the Faneuil Branch Library in Oak Square [pictured at right].

How do the data on the branch libraries compare to this superficial assessment? The trustees have stated that they will be guided in their decision-making by data about each of the branch libraries, in addition to other important qualities such as connection to other community centers:
Library administrators will rank the 26 neighborhood branches by foot traffic, computer use, and how many Web surfers use laptops to log on to Wi-Fi networks. They will count how many programs are offered at each location and tally the number of people who attend storytime and English classes.
Below are a few sets of data on the Allston-Brighton branch libraries that were taken from a compilation on the BPL website. Statistics date from fiscal year 2007, which allows for a direct comparison among the branches (since the Brighton branch was closed for renovations in early 2009). I am impressed by the methodological data collection that BPL has undertaken, and the ease with which a member of the public can access the information from the internet. If only all government agencies were like this!

Based on these indicators -- many of which the BPL trustees said they would be using in arriving at their decision -- it would appear that the Faneuil branch library is the most likely to be closed. In fact, the Faneuil branch ranked last in all but one indicator.

The Presentation School Foundation has already initiated a campaign in order to drum up support for the Fanueil library and lobby the city to keep it open. Based on these data, however, the PSF's work is cut out for them.


Most Recent Renovation or Construction (i.e., Most Modern Facilities)
  1. Brighton: built 1969, renovated 2010
  2. Honan Allston: built 2001
  3. Faneuil: built 1931
Size of Collection (in volumes):
  1. Brighton: 76,900
  2. Honan Allston: 74,000
  3. Faneuil: 47,200
Size of Facility (in square feet of floor space):
  1. Brighton: 22,400
  2. Honan Allston: 20,000
  3. Faneuil: 7,600
Items Circulated:
  1. Brighton: 120,710
  2. Honan Allston: 118,117
  3. Faneuil: 93,043
Number of Volumes Used by the Public:
  1. Honan Allston: 14,540
  2. Brighton: 9,841
  3. Faneuil: 2,902
Meeting Room?
  1. Brighton, Honan Allston: yes
  2. Faneuil: no
On-Site Parking Spaces:
  1. Honan Allston: 20
  2. Brighton: shared lot (with courthouse)
  3. Faneuil: none
Public Computers:
  1. Honan Allston: 17
  2. Brighton: 14
  3. Faneuil: 12
Number of Visitors:
  1. Honan Allston: 82,895
  2. Brighton: 77,857
  3. Faneuil: 61,568
Number of Class Visits:
  1. Honan Allston: 101
  2. Brighton: 58
  3. Faneuil: 53
Number of Library-Sponsored Programs Within Boston Public Schools:
  1. Honan Allston: 25
  2. Brighton: 4
  3. Faneuil: none
Number of Students Requesting Library Assistance:
  1. Brighton: 701
  2. Honan Allston: 254
  3. Faneuil: 198
Use of Meeting Rooms by Public Organizations:
  1. Honan Allston: 98
  2. Faneuil: 83
  3. Brighton: 27
Number of People Seeking "Orientation and Instruction":
  1. Honan Allston: 1,736
  2. Brighton: 981
  3. Faneuil: 720
Number of People Receiving "Literacy Training and Assistance":
  1. Brighton: 199
  2. Honan Allston: 116
  3. Faneuil: 10
One statistic appears inaccurate to me: the number of class visits at the Brighton branch. The reason is that nearby Winship Elementary School has no on-site library, yet during a visit to the school earlier this year I was told that they have a regular program to visit the Brighton branch library as a substitute. Four classroom visits per year therefore appears inaccurate.

Another issue that is bound to be raised is that the Faneuil branch would be a nearby resource for a future community center at the former Presentation School in Oak Square; that future connection will not be reflected in assessments of past connections.

A final issue which appears contradictory is that the Faneuil branch had its meeting rooms used more often by public organizations than the Brighton branch, yet BPL documentation lists the Faneuil branch as having no meeting rooms. (I assume that the "meeting room" that is being referred to in the Faneuil branch is the small stage in the children's book wing -- which cannot be used separately from the rest of the room.)

Lacking from these indicators is a measurement of the number of "community centers" connected to each branch library. How exactly this term is defined may determine which branch comes out on top.

Another indicator missing from these is how "central" the branch is to the neighborhood or the public. That's a hard thing to quantify, although it probably already appears in the statistics for the numbers of visitors (gate count) and the circulation statistics.

Finally, the number of children's events (book readings, magic shows, etc.) is not summarized in the information on the BPL website. Based on my experience, I suspect that the Brighton branch will come last in this category -- but there should be a more quantitative measure available on it, too.


Let me add my own architectural category:

Most Interesting Architecture:
  1. Honan Allston: Beautiful building inside and out. A real treat to visit.
  2. Faneuil: Cool Art Deco exterior (only building of that style in Allston-Brighton). Awful and cramped interior that makes you forget its beautiful exterior.
  3. Brighton: Horrendous Stalin-esque exterior (which, in 1969, replaced a beautiful building!). Unknown interior (until renovations are complete).

Friday, March 05, 2010

Lowe's Unfamiliar With Massachusetts Culture

Lowe's may want to build a new home improvement store in Brighton Landing at the former Barry Controls building, but at a neighborhood meeting Thursday night Lowe's made it sound like the company doesn't understand Massachusetts culture.

One audience member asked, "Would you consider putting a Dunkin' Donuts in?"

Lowe's site development manager Larry LePere responded that he had actually raised the issue with Lowe's management before in other projects, but was always struck down by his bosses -- such that he got the message not to raise the issue again.

LePere didn't mention, however, that the nearest Dunkin' Donuts (aka Dunking Doughnuts) is far, far away from the proposed development site -- two blocks away, that is, at the corner of North Beacon Street and Market Street. You know, the one that used to have the 1957 sign [upper right] that was torn down nearly two years ago.


Image of former Dunkin' Donuts sign in Brighton:

Monday, March 01, 2010

Will Lowe's Continue to Misrepresent Traffic on Market Street?

Lowe's is scheduled on Thursday night to present to the Brighton Allston Improvement Association their revised plans for construction of a home improvement store in Brighton Landing. Lowe's is currently locked in a struggle with New Balance over competing development plans for those parcels.

Mayor Thomas Menino rejected Lowe's first proposal for the store in 2007 because of the traffic problems it would create.

A year-and-a-half ago Lowe's presented the first revision in their plans in which they first promised to spend $1.2 million to improve traffic signals on Market Street and North Beacon Street. If those improvements were found to reduce vehicle travel times, Lowe's representatives proposed that they should be permitted to construct their store.

In Lowe's traffic study, however, they substantially misrepresented the existing traffic situation on Market Street, stating travel times that are approximately three times longer than actual measured times. Lowe's characterization of travel times on Market Street are, simply put, way off.

Will Lowe's on Thursday continue to misrepresent the existing traffic conditions on Market Street?

In 2008 Lowe's representatives told the BAIA:
Lowe's traffic engineering consultants claim that it currently takes 14.4 minutes to travel along Market Street from Washington Street to Lincoln Street during morning rush hour, and the reverse trip during evening rush hour takes 17.6 minutes. They also claim that travel on North Beacon Street from Market Street to Union Square takes 10.2 minutes eastbound during morning rush hour or 15.0 minutes westbound during evening rush hour.
Their consultants were stating the travel times estimated from computer modeling of Market Street traffic patterns, not those actually measured in a vehicle on the street.

So what does the experimental physicist in me want to do? Measure the actual travel times. During morning and evening rush hour the past couple of weeks I made a series of timings of the travel time from crossing Washington Street to the time crossing Lincoln Street (or vice-versa). Morning timings were taken in a car and evening timings were taken from MBTA bus #86, which should be even slower than normal traffic because of the added time of allowing passengers to get on and off. [See the bottom of the post for more details on the measurements.]

Actual travel times: between four and seven minutes.

Predicted travel times from Lowe's computer models: between 14.4 and 17.6 minutes.

The results show that Lowe's predictions of travel times are three-and-a-half times too large for northbound travel on Market Street during morning rush hour, and two-and-a-half times too large for southbound travel on Market Street during evening rush hour.

The conclusion: Lowe's and their traffic consultants in 2008 massively misrepresented how bad the traffic is on Market Street.


Why Would Lowe's Massively Over-Estimate the Market Street Travel Times?

Lowe's proposed in 2008 that, if they could reduce the travel time by spending money on improving the timing of the traffic lights, then they should be allowed to proceed on constructing their box store in Brighton Landing:
[Lowe's and their consultants] claim that construction of their proposed, big box store will reduce average trip times along Market Street by 13-28% and along North Beacon Street by 3-11%...

...If there is more traffic on nearby streets, shouldn't this mean that it would take longer to go anywhere by car?

Not if Lowe's paid $1.2 million up front, prior to any approvals for construction of the store, in order to improve traffic signals in the area by synchronizing them. Lowe's insists that they will put a condition on their construction that they must first demonstrate a reduction in trip time from the signal improvements to Market Street and North Beacon Street.
But the actual travel time is already much better than Lowe's represented it to be; the existing travel times are a 50-67% improvement over their flawed computer models, much more than their proposed 3-28% improvement.

The cynical explanation is that Lowe's might be over-estimating the travel times in order to guarantee that it will appear as though their traffic signal improvements will improve the travel times. It's hard to know whether or not this is the real reason, but I am willing to bet that the BAIA asks some pointed questions at Thursday's meeting.

It's hard to imagine why a traffic consultant -- presumably paid by Lowe's for many hours, days, or even weeks of engineering work -- wouldn't bother to spend an additional hour or two driving up and down the street measuring the actual travel times. Unless, of course, the engineers made the measurements, found them less favorable than the computer model's predicted times, and chose not to make mention of the discrepancy. But that is a purely speculative conspiracy theory.

Their computer model travel times don't make any sense, either. The distance between Lincoln and Washington streets is 0.75 miles, so Lowe's model predicts average vehicle speeds of 3.1 mph in the morning and 2.6 mph in the evening. Those speeds are so slow that many young children could walk faster.

Let's hope that their traffic engineers have driver's licenses and own cars so that they can drive up and down the street a few times before Thursday's meeting.


Other Traffic Issues

Other things to look for in Thursday's presentation by Lowe's traffic engineers: whether they are using the same traffic study or a new one; if they are using the magical stroke-of-the-pen to declare "that 50% rather than 25% of the traffic would already be driving in the area on other errands"; how much the relocation of Briggs from one of the parcels is improving the traffic in the study, rather than other changes (such as a reduction in size of the store or traffic signal improvements); and how Lowe's deals with New Balance's counter-proposals to create a flyover on/off ramp to the Mass Pike and have a commuter rail station near Everett Street.


Measurements

Morning rush hour northbound [measured by car]:
Average 4.0 minutes (individual measurements: 4:27 and 3:27), compared to Lowe's predictions of 14.4 minutes. Neither measurement was within a factor of three of Lowe's predictions.

Morning rush hour southbound [measured by car]:
Average 4.2 minutes (individual measurements: 4:37 and 3:50); no Lowe's prediction given.

Evening rush hour southbound [measured on MBTA bust #86]: Average 6.9 minutes (individual measurements: 7:35, 5:30, 6:50, 7:30), compared to Lowe's predictions of 17.6 minutes. Not one measurement was within a factor of two of Lowe's predictions.

Evening rush hour northbound:
No measurements or predictions.


[above right] Image of a traffic jam in India: